Back on land. A couple of things, some of which are reposted here for easy reference:
This NY Times article from 2010 quoting Disney is the source of the "10 rides per day on average" number. I don;t know whether FP+ has increased that. It may have added 1 (because not everyone uses all 3 FPs). So maybe 11 now?
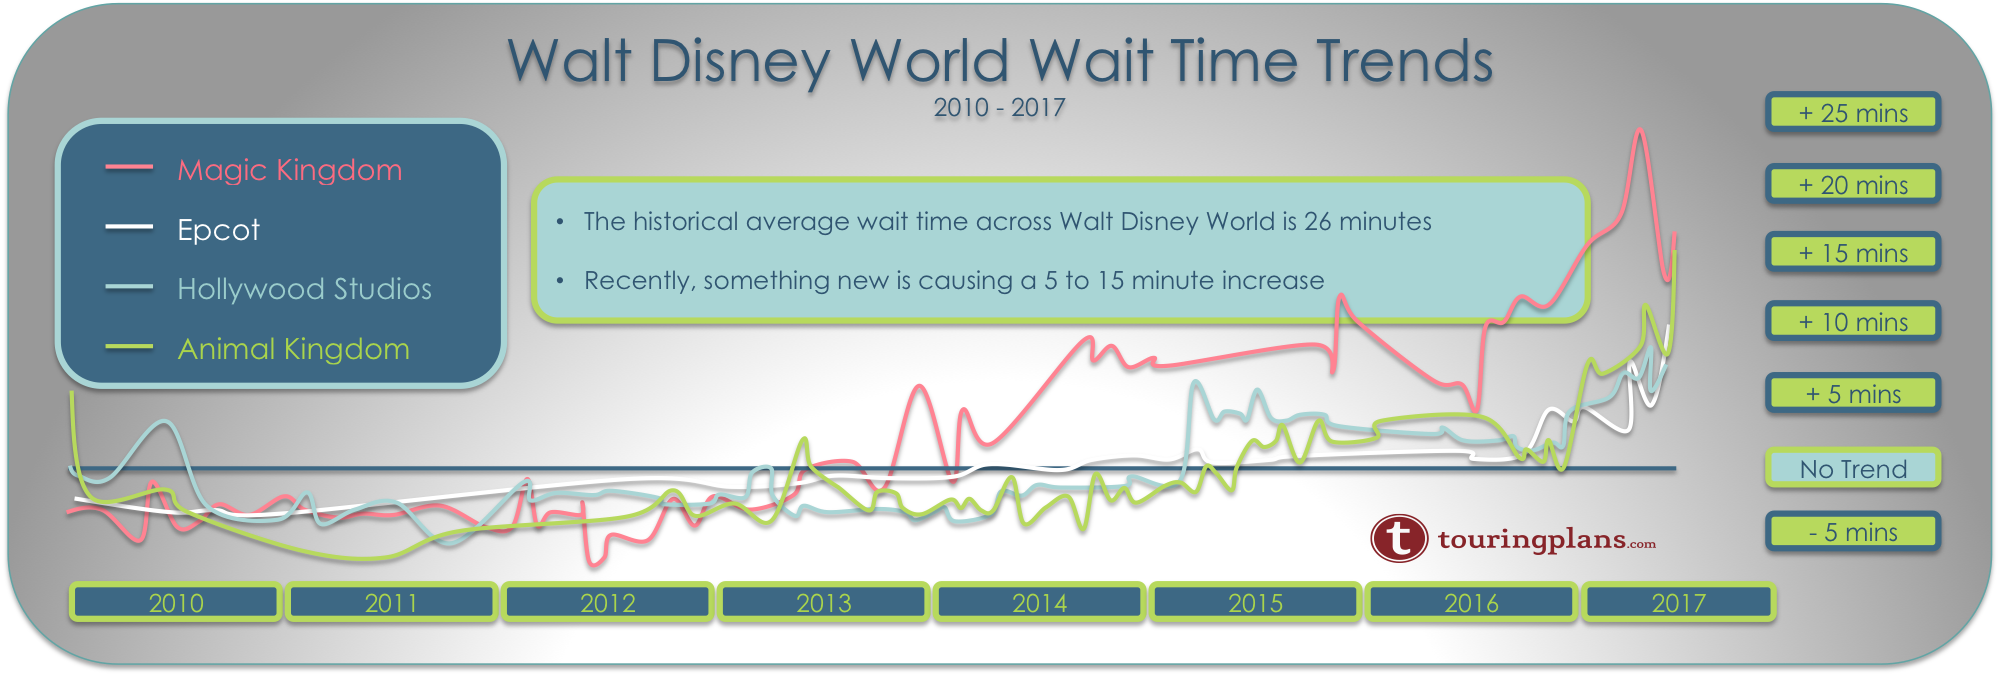
We first suspected Disney was cutting ride capacity/staffing back in late summer 2015, when wait times increased much faster than attendance possibly could. Here's a chart from last year showing the increase in wait times since 2010, at all four WDW parks:
As of late 2017, wait times were up 20% to 60% from 2014/2015. There is zero chance - none at all - that attendance is up that much.
We factor those cuts into our crowd calendar models.
The differences we saw in January 2018 were beyond those cuts. As I've said, we think some of that was a better economy and postponed trips from September's hurricane. Universal's wait times were higher than expected, too, which would point to a general trend across Orlando. But Disney's wait times were much higher.
We didn't arrive at a cause of reduced capacity until the first week of February, when we started counting riders. View the numbers below with some skepticism. Also, we focused on headliners with high capacity, so changes at attractions like Mad Tea Party wouldn't be picked up through rider counts.
Seven Dwarfs Mine Train Average Riders/Hour After 2/21: 1,443 Before 2/21: 1,103 (-24%)
Big Thunder (WDW) After 2/21: 1,570 Before: 1,232 (-22%)
Buzz Lightyear (WDW) After 2/21: 1,813 Before: 1,351 (-25%)
Space Mountain (WDW) After 2/21: 1,620 Before: 1,443 (-11%)
Those numbers exclude obvious breakdowns, of which this week has been notable. It includes wheelchair stops, which seem to be consistent. The numbers are measured during the same time window across days.
Rides that seem about the same: Haunted Mansion (WDW and DLR), Small World (DLR), Dinosaur, Expedition Everest, Pirates (WDW and DLR), Star Tours (WDW and DLR), Toy Story (WDW at 2/3rds capacity), Soarin' (WDW), and Jungle Cruise (DLR).
Capacities at Rock 'n' Roller Coaster and Space Mountain (DLR) haven't been consistent, and we're trying to figure out why. Splash (WDW) wasn't up enough to measure. Kilimanjaro Safaris has unpredictable animal slowdowns, but generally looks consistent.
In the case of 7DMT, BTMRR, and Space (WDW), the reduced capacity was from running fewer ride vehicles on the track, which is fairly easy to see. For 7DMT, where people line up an hour before the park opens, it's hard to come up with a good reason ever to run the ride at less than 100% capacity. To see 3 trains running instead of 5 should raise some questions.
It's possible that those older rides (especially Space) were running at reduced capacity simply because they break down too often when run at 100% capacity for days on end. Space, Tower, and Test Track are among the most breakdown-prone in WDW.
Management might look at 85% capacity all day as better than 0% capacity for an hour - the chaos from rescheduled FP+ reservations alone would probably be enough to make that decision, especially at Epcot and DHS, which have fewer headliners to spread out crowds.
Last point for this post: The reason why I'm talking about reduced capacity is that we (touringplans) try to understand the causes when our models are wrong, and explain them. As a businessperson, I totally understand Disney's motivation for doing it. One of our goals with TP has always been transparency and objectivity with the data, and that's what we're trying to do with these conversations.