threvester
Well-Known Member
California Coronavirus Update: New Case Average Up 295 Percent In Past Month, Now Regularly Near All-Time HighsWhat should be done is what California is doing.
sure...seems like they are doing a wonderful job
California Coronavirus Update: New Case Average Up 295 Percent In Past Month, Now Regularly Near All-Time HighsWhat should be done is what California is doing.
Mods have warned in other threads that doing the laughing emoji repeatedly on the same poster could get ya a temp ban. Just a heads up.
They have closed things again and theme parks aren't opening.California Coronavirus Update: New Case Average Up 295 Percent In Past Month, Now Regularly Near All-Time Highs
sure...seems like they are doing a wonderful job
Yeah I figured that out about these boards a long time ago.He’s only laughing, because we still don’t have thereaction emoji.
In response to this keep in mind 25% of Covid deaths never had a Covid test. Just assumed. Truth is we will never know the actual amount of people who have/had it or died from it.
I do find it interesting to see how far off the million dollar models paid for cited by governments are off a bit. According to the official MN state model revised in mid May, MN expected deaths to total to be 29,000 with full lockdown stay at home in place until 6/1, and 49000 if no lockdown. MN cumulative total today is 1573
are they doing anything???
may the odds be ever in your favorNah. Apparently despite that article listing FL as one of the states that should “roll back” and consider reckoning some things, we will NOT be closing gyms because having a healthy lifestyle makes you less at risk to suffer adversely from the virus.
*Feeling like I’m living a real-life Hunger Games down here.
pick one they are all a bit high to say the leastWhy does the graph you attached look like it was done in crayon?
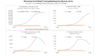
The graphs below are from that PDF....not sure why I was intrigued enough to look. I though certainly no one could have made a graph that bad as the one you posted...
As you can see they are scenario based. Where are the scenarios in the one you posted?
I do find it interesting to see how far off the million dollar models paid for cited by governments are off a bit. According to the official MN state model revised in mid May, MN expected deaths to total to be 29,000 with full lockdown stay at home in place until 6/1, and 49000 if no lockdown. MN cumulative total today is 1573
So, please correct if wrong, but scenario 8 shows 988 -1494 deaths by end of May........
And you are saying they are at 1500+ as of today. A far far far cry from your post below stating 27000 deaths predicted and the accompanying weird graph, wouldn't you say?
Also, the stay at home until 6/1 number seems to be a similar range, if not the exact same. So your borrowed analysis is way way way off.
I don't blame you as you were just basically retweeting without giving credit....
But I would strongly suggest digging in a bit before just retweeting.
Or at least give credit so you don't take all the heat.....
??
Snark not needed, and you might look again, with stay at home till 6/1 the number of deaths predicted is 28231 for the year. Also note the stay at home order was lifted 5/13. They are at 1500 today, with the last month daily deaths averaging in the single digits.
scenario 5-6
every scenario has greater that 22,000 deaths for the year, up to unmitigated has 57000
So you are comparing YTD deaths with what they are predicting for the entire year?
Their YTD numbers fall in line with where they are today.
Your borrowed analysis misses the mark and is misrepresenting the data.
missed my editSo you are comparing YTD deaths with what they are predicting for the entire year?
Their YTD numbers fall in line with where they are today.
Your borrowed analysis misses the mark and is misrepresenting the data.
missed my edit
Now if you think at a minimum 20,000+ will die in MN in less than six months then you would be correct.
Since you are having fun nitpicking, you are wrong again, the graph had the twitter handle on it, smhYou missed mine as well......
ETA: was also pointing out that you were sharing a tweet without giving the credit to the tweet. No snark intended...
They are referring to 12 months not a calendar year. Day 0 in the model appears to be March 22.missed my edit
Now if you think at a minimum 20,000+ will die in MN in less than six months then you would be correct.
Since you are having fun nitpicking, you are wrong again, the graph had the twitter handle on it, smh
So do you think that MN will see 20,000-30,000 deaths YTD?
They are referring to 12 months not a calendar year. Day 0 in the model appears to be March 22.
I obviously hope the model is wildly incorrect. It sadly hasn't been so far in terms of deaths.
Does Florida have a model? It would be more relevant to this thread.
Register on WDWMAGIC. This sidebar will go away, and you'll see fewer ads.