A Spirited Perfect Ten

ParentsOf4

Well-Known Member
Because of the small delta relative to years where things were added vs not added?
One of the more interesting patterns (to me ;)) in the graph that I posted is that the domestic Parks & Resort business has become increasingly susceptible to recessions.

Disney's domestic revenue grew during the first 2 U.S. recessions on the graph (1973-1975 and 1981-1982) but declined during recessions after that, with the declines becoming increasingly severe.

My theory is that this pattern was triggered by Michael Eisner's double-digit ticket price increases from 1984-1987. For those 4 years, WDW ticket priced increased by an average of 18% each year! :jawdrop:

Since then, ticket price increases generally have outpaced Median Household Income.

Prior to the 1984-1987 increases, consumers considered a vacation at WDW to be a good value. During recessions, consumers run towards value. They tend to spend their money more intelligently.

As the value of a WDW vacation has declined, WDW increasingly has become a luxury item that consumers of moderate means cut in difficult times.

The following graph compares changes to WDW ticket prices across several categories of ticket against changes to Median Household Income.

WDW tickets.jpg


One of the sad facts is that a WDW vacation is at least twice as as expensive for consumers today compared to the early 1980s. :(

Ticket types have come and gone throughout the decades. For example, WDW has not always offered 3-day, 4-day, and 7-day tickets. To get a better understanding of how ticket prices have changed, a baseline value of "1" was established in 1971 (WDW's first year) and deltas to ticket prices were then compared and averaged each year after. This was then plotted against changes to Median Household Income, which also used a baseline value of "1" in 1971.

The big drop in 2005 was a result of the creation of the Magic Your Way (MYW) ticket. Prior to MYW, WDW tickets were all inclusive. MYW uses an a la carte pricing scheme. An apples-to-apples comparison of tickets from 2004 versus 2005 shows a big price increase. However, my opinion is that the "base" MYW ticket offered cost sensitive consumers a less expensive option, thus opening up the parks to more, which is why I compared WDW's standard ticket in 2004 to WDW's base MYW ticket in 2005.

One of the downsides of constantly increasing ticket prices faster than income is that WDW has grown increasingly susceptible to recessions.
 

ford91exploder

Resident Curmudgeon
One of the more interesting patterns (to me ;)) in the graph that I posted is that the domestic Parks & Resort business has become increasingly susceptible to recessions.

Disney's domestic revenue grew during the first 2 U.S. recessions on the graph (1973-1975 and 1981-1982) but declined during recessions after that, with the declines becoming increasingly severe.

My theory is that this pattern was triggered by Michael Eisner's double-digit ticket price increases from 1984-1987. For those 4 years, WDW ticket priced increased by an average of 18% each year! :jawdrop:

Since then, ticket price increases generally have outpaced Median Household Income.

Prior to the 1984-1987 increases, consumers considered a vacation at WDW to be a good value. During recessions, consumers run towards value. They tend to spend their money more intelligently.

As the value of a WDW vacation has declined, WDW increasingly has become a luxury item that consumers of moderate means cut in difficult times.

The following graph compares changes to WDW ticket prices across several categories of ticket against changes to Median Household Income.

View attachment 78977


One of the sad facts is that a WDW vacation is at least twice as as expensive for consumers today compared to the early 1980s. :(

Ticket types have come and gone throughout the decades. For example, WDW has not always offered 3-day, 4-day, and 7-day tickets. To get a better understanding of how ticket prices have changed, a baseline value of "1" was established in 1971 (WDW's first year) and deltas to ticket prices were then compared and averaged each year after. This was then plotted against changes to Median Household Income, which also used a baseline value of "1" in 1971.

The big drop in 2005 was a result of the creation of the Magic Your Way (MYW) ticket. Prior to MYW, WDW tickets were all inclusive. MYW uses an a la carte pricing scheme. An apples-to-apples comparison of tickets from 2004 versus 2005 shows a big price increase. However, my opinion is that the "base" MYW ticket offered cost sensitive consumers a less expensive option, thus opening up the parks to more, which is why I compared WDW's standard ticket in 2004 to WDW's base MYW ticket in 2005.

One of the downsides of constantly increasing ticket prices faster than income is that WDW has grown increasingly susceptible to recessions.

Excellent points all, One factor which you have not made explicit is recently the recessions are doing an increasing amount of long term structural damage to the economy, Based on the employment figures we still have not recovered the jobs lost in the 2008 recession. And in many parts of the country especially the northeastern states the economy by some measures has never recovered from the 2001 recession.

With this US consumers simply no longer have the purchasing power they once did and your chart indicates this.
 

Goofyernmost

Well-Known Member
One of the more interesting patterns (to me ;)) in the graph that I posted is that the domestic Parks & Resort business has become increasingly susceptible to recessions.

Disney's domestic revenue grew during the first 2 U.S. recessions on the graph (1973-1975 and 1981-1982) but declined during recessions after that, with the declines becoming increasingly severe.

My theory is that this pattern was triggered by Michael Eisner's double-digit ticket price increases from 1984-1987. For those 4 years, WDW ticket priced increased by an average of 18% each year! :jawdrop:

Since then, ticket price increases generally have outpaced Median Household Income.

Prior to the 1984-1987 increases, consumers considered a vacation at WDW to be a good value. During recessions, consumers run towards value. They tend to spend their money more intelligently.

As the value of a WDW vacation has declined, WDW increasingly has become a luxury item that consumers of moderate means cut in difficult times.

The following graph compares changes to WDW ticket prices across several categories of ticket against changes to Median Household Income.

View attachment 78977


One of the sad facts is that a WDW vacation is at least twice as as expensive for consumers today compared to the early 1980s. :(

Ticket types have come and gone throughout the decades. For example, WDW has not always offered 3-day, 4-day, and 7-day tickets. To get a better understanding of how ticket prices have changed, a baseline value of "1" was established in 1971 (WDW's first year) and deltas to ticket prices were then compared and averaged each year after. This was then plotted against changes to Median Household Income, which also used a baseline value of "1" in 1971.

The big drop in 2005 was a result of the creation of the Magic Your Way (MYW) ticket. Prior to MYW, WDW tickets were all inclusive. MYW uses an a la carte pricing scheme. An apples-to-apples comparison of tickets from 2004 versus 2005 shows a big price increase. However, my opinion is that the "base" MYW ticket offered cost sensitive consumers a less expensive option, thus opening up the parks to more, which is why I compared WDW's standard ticket in 2004 to WDW's base MYW ticket in 2005.

One of the downsides of constantly increasing ticket prices faster than income is that WDW has grown increasingly susceptible to recessions.
Although a very nice, and I'm sure accurate graph, there is an important element left out of the picture. That is that Disney is not a necessity. It is an vacation location that can easily be put off until better economic times. The idea the it is/was the increase in ticket prices that was the straw that broke the camels back, I don't think is true.

If you consider that even with that price the smallest part of the cost of a Disney Vacation is the ticket price. High? Absolutely, but compared to resort staying for a family, transportation, meals etc. it is quite small. It is not, in my mind the trigger factor. It didn't help, but all it takes to see when it becomes a factor of cost is when you look at the room rates. You might as well take out a loan from the mob considering the gouging that the public is taking on that portion of it.

For example, later this month, I am planning on a quick three day trip to Orlando. I don't live as far away as some, but, North Carolina is 600 miles away. With my non-expiration 10 day ticket the trip will cost me, for everything approximately $687.00. The reason for that is that I won't stay onsite. So, here's the deal... I can afford to buy tickets to the parks, pay for my transportation and meals and lodging offsite. What I cannot do is that exact scenario and stay in one of those resorts on property. That cost is the one that people are eliminating, if you judge by the number of people in the parks on a daily basis that is either staying the same or is going upward at the same time that resort stays are falling. All those people are staying someplace. One doesn't have to be an accountant to see what part of that situation is the unaffordable part.

It really doesn't matter how much ticket prices have increased ahead of household income. That part is obviously still affordable. As I said, it isn't a necessity, it is a planned getaway and budgeted separate from other living expenses (hopefully). One wouldn't usually go to WDW just to stay in the resorts. You stay in the resorts to have access to the parks. I know some do just go to a resort and nothing else, but, those that do are not in the least worried about household income vs. ticket prices.

To me it is simple. They are not filling the resorts because they are charging almost criminal rates for people to stay there. In my opinion if they lower the resort prices to a reasonable competitive figure, the parks AND the resorts will be full. Unfortunately, Disney has figured out that with the prices that they charge they make as much money only selling 10 rooms then they would if the number were 20 rooms at a real world rate. Overhead, cleaning and maintenance is much less the fewer people that are there. So what it will boil down to is that those that cannot afford to stay onsite, will stay offsite and still buy those park tickets and still be able to afford a modified Disney Vacation.
 
Last edited:

ParentsOf4

Well-Known Member
Although a very nice, and I'm sure accurate graph, there is an important element left out of the picture. That is that Disney is not a necessity. It is an vacation location that can easily be put off until better economic times. The idea the it is/was the increase in ticket prices that was the straw that broke the camels back, I don't think is true.
I simply wrote that WDW's higher prices have made its business more susceptible to recessions.

At no point did I suggest that WDW was a "necessity".

:)
 

flynnibus

Premium Member
However, to @RSoxNo1's point, I will add that this graph explains why Parks & Resorts has become risk adverse.

I would say double digit growth for 30 years is pretty good... but we know much of that growth comes from price increases. Those columns need a second dimension of price increase to subtract out so real growth can be seen.

I think it's a sad world we live in where 10% YoY growth for DECADES is not sufficient :/
 

Goofyernmost

Well-Known Member
I simply wrote that WDW's higher prices have made its business more susceptible to recessions.

At no point did I suggest that WDW was a "necessity".

:)
I know that Po4, but, it is as big a consideration when attempting to determine affordability. From your other graphs and such, it is pretty much a fact that increased attendance is higher then before but not increasing at previous rates. That part is the part that tells one that there is a problem. But, that problem isn't limited to just one factor in the costs. Lodging costs more, tickets cost more, transportation costs more, food costs more. Of all those things, which do work together to make people decide if they can afford to go or not, the highest percentage of increase has been in lodging from what I can tell. Transportation, Food and ticket access to that or any other venue outside the category of necessity can happen if the lodging is less expensive. The three necessary portions are Transportation, Food and Ticketed Admittance to the the idea of a Disney Vacation. Disney lodging is not one of the items that is necessary to a Disney Trip!

But, fewer people or not, they still are having record profits (in dollars) (you cannot spend percentages) so until that happens there is nothing that will be done or in their vision, should be done.
 

Crazydisneyfanluke

Well-Known Member
I'm not holding breath but...Jurassic Park jeep ride?! Perish the thought!

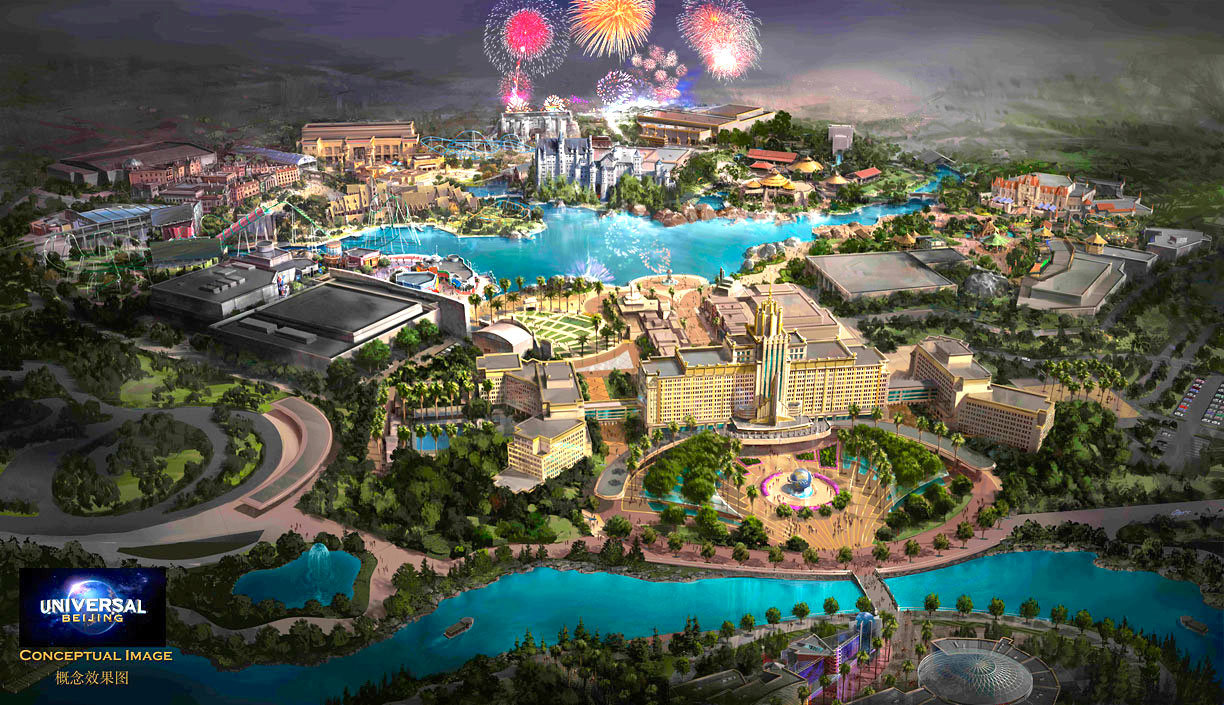
Also, could you lend an ear to the accuracy of those concept maps released last fall? If they're not just idealizations then there are already glaring similarities to their previous parks and properties:

universal-studios-beijing-concept.jpg
Looks like they might get the same hulk as IoA.
 

ford91exploder

Resident Curmudgeon
I would say double digit growth for 30 years is pretty good... but we know much of that growth comes from price increases. Those columns need a second dimension of price increase to subtract out so real growth can be seen.

I think it's a sad world we live in where 10% YoY growth for DECADES is not sufficient :/

We have a broken financial market, Where simply making a profit is not sufficient right now we have situation where the bean counters are in charge and making good 'financial' decisions but poor BUSINESS decisions.

Example I have a Husqvarna chainsaw it's an Anniversary model the 300'th Anniversary of Husqvarna (a Swedish company) did I mention its 25 years old and it STILL cuts wood as well as the day I bought it yes I've bought a few bars and chains and even a new cylinder but Husqvarna STILL has all the parts available, No 'forced obsolesence', And gee when I need additional outdoor power equipment it says Husqvarna i wonder why that is???

I can't see most US companies making it over the next 25 years without them being purchased by forward thinking European and Asian companies who will run them MUCH differently where growth while important to a degree is less important than long term profitability.

The 'make the next quarter's numbers mindset' is the most destructive thing to come out of the 1980's
 

ParentsOf4

Well-Known Member
I love your posts and most of your graphs....I think nearly everything you post is practically spot on, with very little exception.

This one bothers me though. I tell you why -- An astute reader would realize that the Y axis is a percentage of revenue -- not actual revenue. Graphs like that can be misleading if the reader doesn't have an understanding of the how the revenue progressed over parks. If the change in revenue, year after year, is fairly constant -- then this graph, pictorially, tells a clear picture. If the change in revenue, year after year, is not constant -- this graph becomes distorted. I don't know what the underlying revenue trend is, but I would hazard a guess that before major capital expenditures, there was a dip in revenue, due to park guests holding off on visiting until after the project was completed. Epcot, for example, was built during a time where the company as a whole was floundering and WDW had only one major income stream, the MK. It stands to reason that P&R's revenue was quite lower in the year preceding Epcot's opening (the same year they built it) than the year following. With suppressed revenue and a large capex going on, that's going to make the Epcot line on this graph appear much larger than the rest of the lines.
It shouldn’t take an “astute reader [to] realize that the Y axis is a percentage of revenue” since the title of the graph is “Annual Revenue Change”. :D

Total revenue is less important in understanding when looking at company's performance over time. Revenue better increase, if for no other reason than higher prices.

Decades ago, the Ford Motor Company made a tiny fraction of what it does today but it was considerably more healthy in (say) the 1950s and 1960s than it is today.

Some on these forums obsess over absolute numbers. “Disney made X billion last year.” Wall Street doesn't think like that. Total profit is built into the number of outstanding shares of stock. However, stock price is based on change (i.e. EPS). Is profitability up or down? What’s happening in the future that will change profitability?

Investors were not concerned that Disney made only $89.4 million in operating income in 1972. They were excited that net income was up a whopping 49% as a result of the opening of WDW. Wall Street viewed the Magic Kingdom as a huge win.

This is why monitoring change is important. It compares one year to the next in order to evaluate whether things are getting better or worse.
Moreover, unless Disney was able to survive without making returns on their investments, I would expect revenue to take a notch upward after each capital project was completed....so over time, you would expect the normal trend of parks and resorts revenue to be upward...with similar cap-expenditures (or slightly increasing due due to inflation) year over year, this graph would show lower amounts as a percentage of revenue, year after year. That might be misleading.
With regard to major capital expenditures, my graph includes most big-ticket expenditures in order to show how these affect revenue. (MyMagic+ is not included since it’s a relatively small capex item; most of its costs are elsewhere.) In the past, I have provided graphs with smaller capex items but these can be difficult to read since they are busy.

The point of the graph that I provided is to highlight how, over about the last 20 years, big ticket Parks & Resorts expenditures have not resulted in dramatic changes in Parks & Resorts revenue. This is important because Bob Iger joined Disney in 1996.

Iger has never seen a truly successful domestic P&R investment. Early in his career, DAK and DCA were financial duds. Then the post-9/11 economy devastated the tourism industry. WDW was actually closing hotels for a while. Then Disney was able to generate growth through a new ticket price strategy, and later simply by increasing prices much faster than costs. This is why Disney’s current leadership is not big on domestic growth initiatives. Investments did not work while gimmicks did.

The wild success of the Wizzarding World of Harry Potter got executives rethinking this, but the underlying mindset has not changed drastically.

I’ll post something else examining growth capex more closely in a bit that will clearly show how domestic theme park investments have dropped to practically nothing.
 

Rodan75

Well-Known Member
It shouldn’t take an “astute reader [to] realize that the Y axis is a percentage of revenue” since the title of the graph is “Annual Revenue Change”. :D

Total revenue is less important in understanding when looking at company's performance over time. Revenue better increase, if for no other reason than higher prices.

Decades ago, the Ford Motor Company made a tiny fraction of what it does today but it was considerably more healthy in (say) the 1950s and 1960s than it is today.

Some on these forums obsess over absolute numbers. “Disney made X billion last year.” Wall Street doesn't think like that. Total profit is built into the number of outstanding shares of stock. However, stock price is based on change (i.e. EPS). Is profitability up or down? What’s happening in the future that will change profitability?

Investors were not concerned that Disney made only $89.4 million in operating income in 1972. They were excited that net income was up a whopping 49% as a result of the opening of WDW. Wall Street viewed the Magic Kingdom as a huge win.

This is why monitoring change is important. It compares one year to the next in order to evaluate whether things are getting better or worse.

With regard to major capital expenditures, my graph includes most big-ticket expenditures in order to show how these affect revenue. (MyMagic+ is not included since it’s a relatively small capex item; most of its costs are elsewhere.) In the past, I have provided graphs with smaller capex items but these can be difficult to read since they are busy.

The point of the graph that I provided is to highlight how, over about the last 20 years, big ticket Parks & Resorts expenditures have not resulted in dramatic changes in Parks & Resorts revenue. This is important because Bob Iger joined Disney in 1996.

Iger has never seen a truly successful domestic P&R investment. Early in his career, DAK and DCA were financial duds. Then the post-9/11 economy devastated the tourism industry. WDW was actually closing hotels for a while. Then Disney was able to generate growth through a new ticket price strategy, and later simply by increasing prices much faster than costs. This is why Disney’s current leadership is not big on domestic growth initiatives. Investments did not work while gimmicks did.

The wild success of the Wizzarding World of Harry Potter got executives rethinking this, but the underlying mindset has not changed drastically.

I’ll post something else examining growth capex more closely in a bit that will clearly show how domestic theme park investments have dropped to practically nothing.

For all of the talk that others say of 'Walmarting', I think the best corporate horror story to what you are discussing and where you have been leading us to is McDonald's. McD's relied on gimmicks for so long that it missed every opportunity necessary to reinvent their business and drive trends instead of reacting to them. They focused on efficiency at the expense of customer service. Now they are in a position where they are losing market share and have to radically reinvent the business as it stands today to be competitive and trigger new growth.
 

PirateFrank

Well-Known Member
It shouldn’t take an “astute reader [to] realize that the Y axis is a percentage of revenue” since the title of the graph is “Annual Revenue Change”. :D

Total revenue is less important in understanding when looking at company's performance over time. Revenue better increase, if for no other reason than higher prices.

Decades ago, the Ford Motor Company made a tiny fraction of what it does today but it was considerably more healthy in (say) the 1950s and 1960s than it is today.

Some on these forums obsess over absolute numbers. “Disney made X billion last year.” Wall Street doesn't think like that. Total profit is built into the number of outstanding shares of stock. However, stock price is based on change (i.e. EPS). Is profitability up or down? What’s happening in the future that will change profitability?

Investors were not concerned that Disney made only $89.4 million in operating income in 1972. They were excited that net income was up a whopping 49% as a result of the opening of WDW. Wall Street viewed the Magic Kingdom as a huge win.

This is why monitoring change is important. It compares one year to the next in order to evaluate whether things are getting better or worse.

With regard to major capital expenditures, my graph includes most big-ticket expenditures in order to show how these affect revenue. (MyMagic+ is not included since it’s a relatively small capex item; most of its costs are elsewhere.) In the past, I have provided graphs with smaller capex items but these can be difficult to read since they are busy.

The point of the graph that I provided is to highlight how, over about the last 20 years, big ticket Parks & Resorts expenditures have not resulted in dramatic changes in Parks & Resorts revenue. This is important because Bob Iger joined Disney in 1996.

Iger has never seen a truly successful domestic P&R investment. Early in his career, DAK and DCA were financial duds. Then the post-9/11 economy devastated the tourism industry. WDW was actually closing hotels for a while. Then Disney was able to generate growth through a new ticket price strategy, and later simply by increasing prices much faster than costs. This is why Disney’s current leadership is not big on domestic growth initiatives. Investments did not work while gimmicks did.

The wild success of the Wizzarding World of Harry Potter got executives rethinking this, but the underlying mindset has not changed drastically.

I’ll post something else examining growth capex more closely in a bit that will clearly show how domestic theme park investments have dropped to practically nothing.

Thanks for the great response. I agree with all of it. I guess my main point is the inverse of yours. You can't analyze change without context -- so you need the actual numbers. I agree that actual numbers, alone, don't clearly illustrate growth (which, I agree, is what Wall Street is very focused on). So when you look at change, you have to have a basis in what is changing - and understand it - to recognize what is changing, how its changing and whether the change is representative of the big picture.

But all in all, we agree. Thanks for the great, in-depth & informative response.
 

tribbleorlfl

Well-Known Member
That's fantastic question. It looks like it was just a tour.

Beer for pandas?

I remember going to see the pandas, they were in a purpose built habitat that later became the koala exhibit after they left. It was a very big deal at the time and was very crowded.

Yeah, I do remember them being a temporary exhibit and being very busy because of the (at the time) rare opportunity to see them in person in the US. I still have a lapel pin my parents bought me from the visit.

That being said, while I have no reason to doubt the rumor they do not want to loan pandas to for-profit operations, I would think the same reservations would have existed for BG, even for a relatively brief tour stop.

I wonder if there might be more going on behind the scenes than politics to keep pandas out of AK. Pandas are notoriously poor breeders in captivity, and I believe China prefers to place them at facilities with strong breeding reputations. While AK has had births, obviously, I'm not aware of any success in breeding endangered or captivity-adverse species.

Furthermore, I also wonder if climate is a factor. Their natural habitat is mountainous, misty and cool. Florida summers might not be conducive y o their health.
 

PREMiERdrum

Well-Known Member
Furthermore, I also wonder if climate is a factor. Their natural habitat is mountainous, misty and cool. Florida summers might not be conducive y o their health.

They were here in Columbus during a particularly hot summer... they had a nice outdoor yard with climbing structures, but spend dang near the entire summer in their large, 2 room indoor habitat that featured raised beds, pools, and a waterfall.

The building was purposed built for the pandas that summer, and after they left it was mothballed to be used as the indoor portion of the Bonobo facility that opened along with the "African Congo Expedition" that opened a few years later.

An exhibit could easily be imagineered around a collection of mountain village buildings (sound familiar), giving the bears access to both indoor and outdoor areas.
 

Donald Razorduck

Well-Known Member
Pandas? Best kept secrets in the US when it comes to zoos is the Memphis Zoo. No coasters, just quality. Oh, and Pandas.
Their new Zambezi Hippo Camp that's under construction will be impressive.
 

ParentsOf4

Well-Known Member
To follow up my earlier post ...

There are two types of capital expenditures (capex): growth and maintenance.

Growth (or investment) capex
is aimed at expansion. The New Fantasyland, Toy Story Mania, and Pandora are examples of growth capex.

Maintenance capex
is used to keep existing facilities in good working condition. A few years ago, much of Main Street U.S.A. was covered in tarps for repairs to the structures, which were rotting after years of use. Similarly, WDW operates a large fleet of buses that need to be constantly replaced as they reach the end of their useful service lives. These are examples of maintenance capex.

Companies do not distinguish between growth and maintenance capex in their public disclosures but the combined costs of amortization and depreciation provide a reasonable estimate of what maintenance capex should be. Anything above that can be considered growth capex, representing a true investment.

A smaller company will spend less on capex while a larger company will spend more. Therefore, capex usually is evaluated as a percentage of revenue.

It's possible to estimate Disney's domestic theme park investment levels by using the numbers they report for domestic P&R capex (less amortization & depreciation) divided by domestic P&R revenue.

Excluding Disney's investments in its 4 cruise ships, Disney’s estimated domestic theme park growth capex is:

Growth Capex.jpg


Since 2001, theme park growth initiatives have been modest to non-existent. The relatively small bump from 2009 to 2012 represents growth capex spent on the DCA redesign, New Fantasyland, and MyMagic+.

Put into a proper historical perspective, it’s apparent that even Disney's recent ‘big’ projects represent comparatively little investment.
 
Last edited:

GoofGoof

Premium Member
One of the more interesting patterns (to me ;)) in the graph that I posted is that the domestic Parks & Resort business has become increasingly susceptible to recessions.

Disney's domestic revenue grew during the first 2 U.S. recessions on the graph (1973-1975 and 1981-1982) but declined during recessions after that, with the declines becoming increasingly severe.

My theory is that this pattern was triggered by Michael Eisner's double-digit ticket price increases from 1984-1987. For those 4 years, WDW ticket priced increased by an average of 18% each year! :jawdrop:

Since then, ticket price increases generally have outpaced Median Household Income.

Prior to the 1984-1987 increases, consumers considered a vacation at WDW to be a good value. During recessions, consumers run towards value. They tend to spend their money more intelligently.

As the value of a WDW vacation has declined, WDW increasingly has become a luxury item that consumers of moderate means cut in difficult times.

The following graph compares changes to WDW ticket prices across several categories of ticket against changes to Median Household Income.

View attachment 78977


One of the sad facts is that a WDW vacation is at least twice as as expensive for consumers today compared to the early 1980s. :(

Ticket types have come and gone throughout the decades. For example, WDW has not always offered 3-day, 4-day, and 7-day tickets. To get a better understanding of how ticket prices have changed, a baseline value of "1" was established in 1971 (WDW's first year) and deltas to ticket prices were then compared and averaged each year after. This was then plotted against changes to Median Household Income, which also used a baseline value of "1" in 1971.

The big drop in 2005 was a result of the creation of the Magic Your Way (MYW) ticket. Prior to MYW, WDW tickets were all inclusive. MYW uses an a la carte pricing scheme. An apples-to-apples comparison of tickets from 2004 versus 2005 shows a big price increase. However, my opinion is that the "base" MYW ticket offered cost sensitive consumers a less expensive option, thus opening up the parks to more, which is why I compared WDW's standard ticket in 2004 to WDW's base MYW ticket in 2005.

One of the downsides of constantly increasing ticket prices faster than income is that WDW has grown increasingly susceptible to recessions.
This is a good point. I think one of the things that has them gun shy to rush projects or build multiple things at once is the economy. Post 9/11 was a horrible time for tourism in general and especially theme parks.

I think there is one additional thing to consider on why the first 2 recessions noted did not impact the P&R segment as much as the more recent ones. The primary demographic of WDW since inception was the middle class/upper middle class/filthy rich. It was never a cheap vacation. The difference is that the middle class in the 70s into the 80s was comprised of a lot of people who were lifetime employees at their companies. People had pensions and didn't tend to jump around as much. While the recessions could have had an impact on some of these people from companies going bankrupt or layoffs, many were not impacted. If you still had your good, stable job and your pensions waiting at retirement (along with SS) and your house was not at risk of being foreclosed on there was no reason to not take the family vacation to WDW.

Flash forward to the modern era. A recession and a stock market drop impacts a lot more people. Companies are much quicker to cut back and layoff people. Individuals personal finances are much more tied to the stock market. When people see their neighbor laid off and their primary retirement money (their 401k) cut in half and their cousin getting his house foreclosed on it's hard to justify spending the money it costs to go to WDW.

In other words the recent recessions impact WDW's key demographic a lot more than in the past. Another factor is the increase in foreign tourism. Most of the recession referenced were global slow downs. Foreign tourists have additional costs like flying long distances and they generally tend to stay longer. Where a family in NJ can cut back on their vacation and choose to drive to FL and stay 4 nights instead of flying and staying for a week or longer it's not practical (or possible) to do if you are coming from another country.
 

WDW1974

Well-Known Member
Original Poster
Spirited Quickees (because they are the best kind and you haven't had any in months!):

So, $2100 and up for those lovely bungalows sitting on top of Central Fl swamp? Don't ask what I think of the prices because: 1.) You probably know the answer; and 2.) They will be booked solid by crazy DVCers year round.

Should I feel guilty that I have a FP active for Soarin right now when I am sitting at home that I have no intention of canceling? Do I care?

Well, we know WDW has its $139 FL resident ticket offer (one day in one park, good now until early June with ONLY MK blocked out over the Easter period). But DLR, which didn't offer a SoCal discount in recent years, has one again. Only out west, it's $139 for TWO days. Now, is there some hidden message to the fact that the price difference is so ... to quote Iron Man ... stark?

I recall when the WDW Marathon started that it wasn't meant as a profit center for the company. Wouldn't it be nice if RunDisney events proceeds all went to a charity like ... since Disney loves playing them up ... Make a Wish? Of course, they are a typical cold, heartless count every tenth of a penny corporation, but just imagine the good they could do.

Do you get the feeling that some west coast fanboi Twits don't appreciate Cars Land or have grown tired of it? Yeah, they'll probably be feeling the same about Potter by 2017 in Hollywood.

What do I think of the job Soup & Salad Sandra is doing in replacing that amazing bulldog reporter Jason 'Press Release' Garcia? Do you have to ask?

One thing I will give to UNI's BRAND advocates online is that Antojitos has amazing food and drink at reasonable prices. I'll go even further. They have the best Mexican food I've had in FL in the 21st century and it compares favorably with some great Mexican restaurants I've dined at in California and Arizona.

Speaking of UNI and City Walk, what does it say about the confidence in your business and ability to provide quality to your guests that UNI is removing third party locations for locations owned and operated by themselves while Disney is doing the exact opposite over in TMODtBKaDS (The Mess One Day to Be Known as Disney Springs).

There seems to be online backlash against Galavant. All I know was it put a smile on my face, had better music that Frozen and when I called to the Spirited Hillbilly office, I couldn't hear Mrs. Lee talking above @Lee's singing along.

When booking future DVC stays, I have found that having someone living six hours in the future can totally be an advantage.

I've been told that DCL can't simply let the staterooms on the Wonder go any longer (or wait for a major dry dock that likely won't happen before late NEXT year!) and that they are actually redoing cabins while the ship is sailing by taking cabins out of service ... a few each cruise. That is smart. That is something that should have likely been done a few years ago now.

I can't help but think someone didn't invite me to lunch at the Biergarten.

Funny how when Plancha at the Four Seasons offers CMs a 20% discount on dining that every lifestyler puts that up on their sites, but they will NEVER list discounts that WDW O&O locales offer. No, I'm sure that has nothing to do with Lovely Leanne, Crazy Gary, Bland Tommy and Dr. Blondie (who apparently has a new 70s 'do! ... she still can't compare to me rockin' the jorts!) Don't y'all want to know what restaurants have 40% off for CMs, so you can make friends and go to lunch with them at real world prices?

Are the Twits really complaining about Fantasy in the Sky at DL for the winter/spring as Disney readies for Steve Davison's 60th Annivesary spectacular? Seriously, what is wrong with you defectives? They don't have to offer ANY pyro at all. There were months in the past when they didn't (even WDW's MK didn't make pyro a nightly deal until October of 1996). Find something worthy of your online angst.

No, no Golden Globes for Angie and I. One year. Just not this one.

Answer: $250. Question: the most I would ever pay for any standard WDW resort hotel room.

Yes, I admit it, when I was walking around a crowded EPCOT last month I might have been a wee bit jealous that I wasn't with a close associate who was enjoying HKDL (some of his observations to follow in this thread!)

Finally, to the 15--20 of you that I owe notes to ... hopefully, this weekend.
 

Register on WDWMAGIC. This sidebar will go away, and you'll see fewer ads.

Back
Top Bottom