So explain why the constant drum of "there's a long line of people ready to take your job" can't alleviate this...You mentioned something that has been detrimental to staffing: Disney has lost a huge percentage of seasonal (CT—Casual Temporary) CMs. The changing tax laws and Obamacare health care affected that. I won’t get into details because it opens a huge can of worms, but even though some of the changes were based on local people’s working a couple shifts a year and taking advantage of free admission, the majority of CTs were college program alumni who returned during the summer and winter breaks for a dose of the Magic. When the requirements jumped to 150 hours every 6 months (and at least 300 hours/year), most of these college students couldn’t commit. CT staffing plummeted.
-
The new WDWMAGIC iOS app is here!
Stay up to date with the latest Disney news, photos, and discussions right from your iPhone. The app is free to download and gives you quick access to news articles, forums, photo galleries, park hours, weather and Lightning Lane pricing. Learn More -
Welcome to the WDWMAGIC.COM Forums!
Please take a look around, and feel free to sign up and join the community.
You are using an out of date browser. It may not display this or other websites correctly.
You should upgrade or use an alternative browser.
You should upgrade or use an alternative browser.
Len Testa Crowd Analysis
- Thread starter GeneralKnowledge
- Start date
So if you're not one of the first 100 people in the FP+ line, you better hope you don't need a bio break anytime soon.Now. On to the basics here.
Your formula is wrong from jump. Lines don’t work the way you say they do. They don’t continually build up through out the day. They level off, they decrease, they surge.
Attendance and wait time SHOULD correlate. What that correlation is, I don’t know. I do know it’s not your example. Because lines don’t work that way.
Like I said. You are a hobbyist. Which is fine, so am I. But I’m not postulating that I’m more then that.
At this point, I'm willing to admit that 100% FP+ allocation should be considered, and trim the arrival windows down to 15 minutes instead of an hour and 20.
Nubs70
Well-Known Member
The "Golden Equation" is obviously multivariative. It's just something thing has changed at the x^n position. We just have to find it.It's not that simple. There's multiple inputs and a single output, and the results can be affected pretty dramatically by minor changes in one or more of the inputs (hence non-linear). The problem is we don't have enough data to make a determination on which input was the determining one, or if there was more than one input that changed, or how the different inputs differed from previous years. @lentesta did awesome research and provided one data point. But there are many more we need to properly determine what happened.
Nubs70
Well-Known Member
It should correlate if throughput is constantNow. On to the basics here.
Your formula is wrong from jump. Lines don’t work the way you say they do. They don’t continually build up through out the day. They level off, they decrease, they surge.
Attendance and wait time SHOULD correlate. What that correlation is, I don’t know. I do know it’s not your example. Because lines don’t work that way.
Like I said. You are a hobbyist. Which is fine, so am I. But I’m not postulating that I’m more then that.
matt9112
Well-Known Member
Quite a few don't. The number of home schooled kids with no set vacation schedule is also steadily rising.
when the government fails at its job can you blame them? out of all the fancy things in life the one I wish I could afford was private school for my son....no mansion or car is worth as much as private school.
Sirwalterraleigh
Premium Member
Just on the CT/PT things...there was a time (bout 15 years ago) when they let go of all the CTs and many PTs by choice...
They just don't like wages on the books...simple as that...it has nothing to do with healthcare legislation...that's a typical austrailian style hoax.
...Or maybe...all the CTs might be picking up shifts in all the new coal mines and steel mills? They would get hazard pay
They just don't like wages on the books...simple as that...it has nothing to do with healthcare legislation...that's a typical austrailian style hoax.
...Or maybe...all the CTs might be picking up shifts in all the new coal mines and steel mills? They would get hazard pay
Sirwalterraleigh
Premium Member
when the government fails at its job can you blame them? out of all the fancy things in life the one I wish I could afford was private school for my son....no mansion or car is worth as much as private school.
You can write all that stuff off now...have at it

Sirwalterraleigh
Premium Member
We don't know that they lowered capacity from previous years. We know capacity was lower in Jan/early Feb than later in Feb. That's what Lens data shows so far.
I don't know if they lowered capacity...
Why I do know is that neither space, big thunder, nor soarin' had the full ride operational in February between 1-2 hours after opening...
As in I saw it personally...make of it what you will.
matt9112
Well-Known Member
Do people really wait in standby? Refresh the app people.._fastpasses are abundant
sometimes.....I find it hard to get 3 solid morning spots to than start getting more. usually rope drop 3 or 4 things at MK than fast pass 3 and eat around edges when lines dip.
your advice is easy for vacationers since finding 3 in a row would be easy but with ones days notice or so for AP holders it's a little harder. my day usually has to be spread out if I pick headliners.
mikejs78
Well-Known Member
That's another variable. Once Len put out his initial observation, I started checking out wait times periodically, and I was surprised how often major attractions were offline....I don't know if they lowered capacity...
Why I do know is that neither space, big thunder, nor soarin' had the full ride operational in February between 1-2 hours after opening...
As in I saw it personally...make of it what you will.
lazyboy97o
Well-Known Member
Not really. The key there is the amount of capacity dedicated to FastPass+. Your suggestion would more reduce crowding in the park itself. This is undesirable because people are supposed to spend that time in the park shopping and dining. The greater crowding also makes the longer waits more acceptable.Wouldn't it help standby lines if they only allowed 3 fastpasses a day, period? What's the reasoning to allow more when you're done? (From Disney's perspective, I mean. I get it that people will want as many fastpasses as they can get.)
Jenny72
Well-Known Member
Ok, right, so from Disney's perspective, the more fastpasses, the more time you sit in restaurants/etc. waiting for your fastpass time. That makes sense as to why they'd want people to have more. But what about the hordes standing in line for 120 minutes for Peter Pan? I guess those are just casualties of the system.
RSoxNo1
Well-Known Member
Is the increase in wait times just the increase in standby wait time or is it that aggregate when factoring in Fastpass wait times as well? I mean Fastpass+ was essentially live in February 2014 but it became more available beginning in 2013.Back on land. A couple of things, some of which are reposted here for easy reference:
This NY Times article from 2010 quoting Disney is the source of the "10 rides per day on average" number. I don;t know whether FP+ has increased that. It may have added 1 (because not everyone uses all 3 FPs). So maybe 11 now?
We first suspected Disney was cutting ride capacity/staffing back in late summer 2015, when wait times increased much faster than attendance possibly could. Here's a chart from last year showing the increase in wait times since 2010, at all four WDW parks:
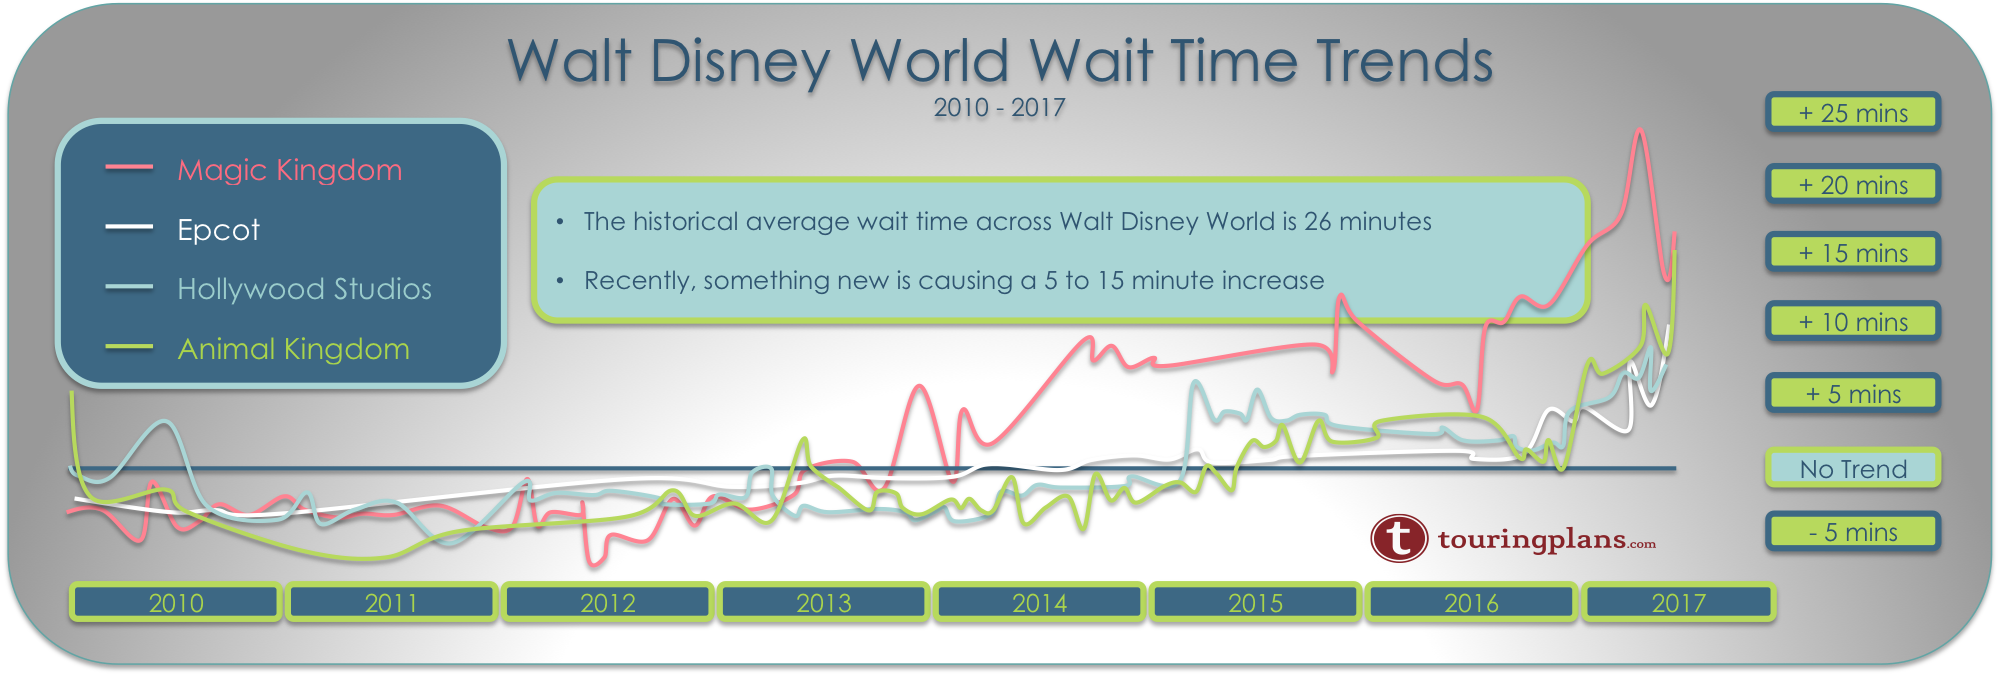
As of late 2017, wait times were up 20% to 60% from 2014/2015. There is zero chance - none at all - that attendance is up that much.
We factor those cuts into our crowd calendar models.
The differences we saw in January 2018 were beyond those cuts. As I've said, we think some of that was a better economy and postponed trips from September's hurricane. Universal's wait times were higher than expected, too, which would point to a general trend across Orlando. But Disney's wait times were much higher.
We didn't arrive at a cause of reduced capacity until the first week of February, when we started counting riders. View the numbers below with some skepticism. Also, we focused on headliners with high capacity, so changes at attractions like Mad Tea Party wouldn't be picked up through rider counts.
Seven Dwarfs Mine Train Average Riders/Hour After 2/21: 1,443 Before 2/21: 1,103 (-24%)
Big Thunder (WDW) After 2/21: 1,570 Before: 1,232 (-22%)
Buzz Lightyear (WDW) After 2/21: 1,813 Before: 1,351 (-25%)
Space Mountain (WDW) After 2/21: 1,620 Before: 1,443 (-11%)
Those numbers exclude obvious breakdowns, of which this week has been notable. It includes wheelchair stops, which seem to be consistent. The numbers are measured during the same time window across days.
Rides that seem about the same: Haunted Mansion (WDW and DLR), Small World (DLR), Dinosaur, Expedition Everest, Pirates (WDW and DLR), Star Tours (WDW and DLR), Toy Story (WDW at 2/3rds capacity), Soarin' (WDW), and Jungle Cruise (DLR).
Capacities at Rock 'n' Roller Coaster and Space Mountain (DLR) haven't been consistent, and we're trying to figure out why. Splash (WDW) wasn't up enough to measure. Kilimanjaro Safaris has unpredictable animal slowdowns, but generally looks consistent.
In the case of 7DMT, BTMRR, and Space (WDW), the reduced capacity was from running fewer ride vehicles on the track, which is fairly easy to see. For 7DMT, where people line up an hour before the park opens, it's hard to come up with a good reason ever to run the ride at less than 100% capacity. To see 3 trains running instead of 5 should raise some questions.
It's possible that those older rides (especially Space) were running at reduced capacity simply because they break down too often when run at 100% capacity for days on end. Space, Tower, and Test Track are among the most breakdown-prone in WDW.
Management might look at 85% capacity all day as better than 0% capacity for an hour - the chaos from rescheduled FP+ reservations alone would probably be enough to make that decision, especially at Epcot and DHS, which have fewer headliners to spread out crowds.
Last point for this post: The reason why I'm talking about reduced capacity is that we (touringplans) try to understand the causes when our models are wrong, and explain them. As a businessperson, I totally understand Disney's motivation for doing it. One of our goals with TP has always been transparency and objectivity with the data, and that's what we're trying to do with these conversations.
So with Fastpass in the 65-70% range for many attractions that means a lot less people are going in through Standby. If Pirates had a 20 minute wait time for all guests before Fastpass+ but now it has a 50 minute standby (for a 3rd of guests) and 5 minute Fastpass (for 2/3rds of guests) that's still a 20 minute average.
mikejs78
Well-Known Member
Because it's a function of demand and capacity. Every hour where demand exceeds hourly throughput adds to the wait time, even if it isn't peak demand. So you could have very different scenarios if you just measure peak demand. Let's say capacity is 2000/hr and at the peak hour, 3000 people get in line. Then the next hour 2500 do, then 2000, then 1500, then 1000. The line will reach no wait that 4th hour after peak.I don’t even know what you are talking about with trend charts and ride times. Are you talking about changes in hourly demand? One of those hours is going to have the biggest demand.
Now let's have the same capacity with the same peak, but instead the demand is 2500 per hour for 3 hours following peak, then a drop off to 2000, 1500, then a spike to 2500 before dropping to 2000, 1500, and finally 1000. At the end of this sequence there will still be 1000 people in line going in to the next hour because the two hours following peak added to the backlog.
This doesn't even take into account hours before peak where demand may be greater than capacity. And both these examples assume that there are periods where demand is below capacity, which isn't necessarily the case.
So knowing the peak is important, but so is knowing the shape of the day and how much total demand will be in relation to total capacity.
RSoxNo1
Well-Known Member
The rest of that park is capable of handling the crowds that Pandora can't handle. Pandora was a draw away from other parks, but the land itself doesn't have the capacity to meet the demand for it.Pandora was an E ticket driver of attendance. The problem is the rest of the park can't handle the additional crowds. The parks need more quality C and D tickets to eat up the crowds without bringing in huge additional numbers.
I suspect the hope is that the other new additions in the coming years will spread those crowds around again. The reality is, they underbuilt both rides. NRJ by about 25% capacity (and possibly 50% in length) and FoP by at least 50% in capacity.
NomeKing88
Member
It’s getting to the point where even adding new attractions to parks like MK isn’t helping. Should theme parks be able to hold 75,000+ people? Obviously Disney wants to fit as many people as possible inside their parks, but it’s getting to the point where popular attractions can’t even serve the amount of interested riders in the park.
If Space Mountain has an hourly throughput of 2000 people, as in, it can only “serve” 2000 people per hour, then in a 12 hr day, Space Mountain can only serve 25,000 people + anyone left in line at the end of the night. And that’s if it doesn’t go down, etc. Compare that to the 60,000+ whatever MK can hold and that’s a lot of guests who can’t ride it.
The only solution to this is to cap the park capacity to a comfortable level. But that’s something they will never do...
tirian
Well-Known Member
There are limited numbers of FT and PT positions available in each department. Disney historically used CPs and CTs to save labor costs and fill the gaps.So explain why the constant drum of "there's a long line of people ready to take your job" can't alleviate this...
This is no different from department stores that hire seasonal employees for the Christmas season.
lazyboy97o
Well-Known Member
You’re engaging in the same kind of bad math. You’ve created a scenario that demonstrates something completely different from what you are taking issue with. What you’ve described is an attraction that does not have enough capacity. You said peak design day hour was a bad basis of design, but nothing you wrote addresses how a 2,000 pph capacity is derived from a 3,000 people peak hour. You did it backwards, you picked a capacity and then made up demand models that it can’t handle instead of deriving your capacity from the demand model.Because it's a function of demand and capacity. Every hour where demand exceeds hourly throughput adds to the wait time, even if it isn't peak demand. So you could have very different scenarios if you just measure peak demand. Let's say capacity is 2000/hr and at the peak hour, 3000 people get in line. Then the next hour 2500 do, then 2000, then 1500, then 1000. The line will reach no wait that 4th hour after peak.
Now let's have the same capacity with the same peak, but instead the demand is 2500 per hour for 3 hours following peak, then a drop off to 2000, 1500, then a spike to 2500 before dropping to 2000, 1500, and finally 1000. At the end of this sequence there will still be 1000 people in line going in to the next hour because the two hours following peak added to the backlog.
This doesn't even take into account hours before peak where demand may be greater than capacity. And both these examples assume that there are periods where demand is below capacity, which isn't necessarily the case.
So knowing the peak is important, but so is knowing the shape of the day and how much total demand will be in relation to total capacity.
Knowing the shape of the day and your total demand informs the difference between your peak design hour and your capacity. This is where attractions per guest per hour comes into play, it is how you determine if 2,000 pph is desirable for a 3,000 people peak hour.
GhostHost1000
Premium Member
I hate to even mention this...and obviously there is a lot of work that needs to be done at the existing parks.... but maybe it's time Disney considers a 5th gate to help spread out crowds? 


Register on WDWMAGIC. This sidebar will go away, and you'll see fewer ads.