-
Welcome to the WDWMAGIC.COM Forums!
Please take a look around, and feel free to sign up and join the community.
You are using an out of date browser. It may not display this or other websites correctly.
You should upgrade or use an alternative browser.
You should upgrade or use an alternative browser.
Themed Entertainment Association 2023 Statistics
- Thread starter OG Runner
- Start date
Honestly, that is what I was looking for, and both Animal Kingdom and Disney Studios were down a bit.Where are the drastic Disney reductions everyone has been going on about?
If you look at the actual report the increases at Magic Kingdom & EPCOT more than made up for it, as
they had higher attendance than those parks last year.
earlthesquirrellover23
Well-Known Member
Also these are estimated attendance numbers for last year, I think most of the attendance being down talks have been about this year.
bwr827
Well-Known Member
I’ve seen countless comments to the effect of, “2023 was awful and 2024 is even more disastrous.”Also these are estimated attendance numbers for last year, I think most of the attendance being down talks have been about this year.
WDWFREAK53
Well-Known Member
Huge drops for Universal. That surprises me.
Do you think some people are putting off trips in anticipating to go when Epic Universe opens?Huge drops for Universal. That surprises me.
AidenRodriguez731
Well-Known Member
Doesn't surprise me.Huge drops for Universal. That surprises me.
Universal hasn't had anything of actual substance open since VC + the main Studios park is in a kinda sad state rn + EU is making people delay their planned trips. I think they will recover in 2025 but 2024 should also be light in Universal's attendance, possibly even more so.
Sorcerer Mickey
Well-Known Member
1) No new attractions worth making the trip since 2021Huge drops for Universal. That surprises me.
2) Ticket prices ballooned during this time
3) Epic is right around the corner
cheezbat
Well-Known Member
I actually have a few friends that literally decided not to come this year and just wait for Epic next year…so yeah…would make sense especially considering the only new thing this year was Dreamworks land. Not something they’d plan a trip for.Do you think some people are putting off trips in anticipating to go when Epic Universe opens?
Tony the Tigger
Well-Known Member
Uni is offering $199 APs to the end of the year. If WDW did that, rumors would be stewing.
BrianLo
Well-Known Member
I actually have a few friends that literally decided not to come this year and just wait for Epic next year…so yeah…would make sense especially considering the only new thing this year was Dreamworks land. Not something they’d plan a trip for.
Same. I’m going for an excessive two weeks at WDW in December and normally would consider Universal for sure, but have decided to skip it for a more dedicated Universal trip next Fall.
Ironically, WDW did minorly get me for that one. I’ll do a free water park day and maybe Boo to you (which I’ve never done before) if I can also see the new night parade. Particularly due to the ‘possible’ restrictive ticketing policy they are considering for Epic. I don’t need more days at USO/IOA.
After that, I won’t come back to either until December 2027 thereafter.
earlthesquirrellover23
Well-Known Member
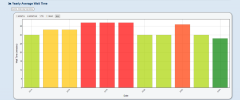
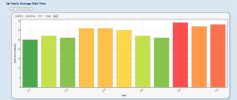
That's possible. I'm actually surprised TEA reported attendance being nearly 20% higher at Epcot and 3.4% higher at MK, because judging from yearly average wait times from thrill-data.com it sure seems like MK was a lot busier in 2022:I’ve seen countless comments to the effect of, “2023 was awful and 2024 is even more disastrous.”
Epcot is a lot closer, but still down a little:
I think the avg. wait time drop at both EPCOT and MK are probably impacted by the new rides opening on virtual queue only, as those rides don't get reflected in the average wait time. MK has a pretty big drop though, but maybe that's because of Splash being closed for most of the year and Tron being on VQ. It is true that wait times don't tell the full story of attendance, but a nearly 20% increase for Epcot from 2022 is huge though and I feel like that would've been reflected a little more in average wait times.
The drop of 9% for both USF and IOA seems to hold up relatively well judging by average wait times:
Attachments
It doesn't surprise me. Osbourne Effect.Huge drops for Universal. That surprises me.
Raidermatt
Active Member
We also cannot assume that other operational factors were consistent from year to year. For example, when attendance drops, some rides are put into a lower capacity mode, which can keep wait times high.That's possible. I'm actually surprised TEA reported attendance being nearly 20% higher at Epcot and 3.4% higher at MK, because judging from yearly average wait times from thrill-data.com it sure seems like MK was a lot busier in 2022:
Epcot is a lot closer, but still down a little:
I think the avg. wait time drop at both EPCOT and MK are probably impacted by the new rides opening on virtual queue only, as those rides don't get reflected in the average wait time. MK has a pretty big drop though, but maybe that's because of Splash being closed for most of the year and Tron being on VQ. It is true that wait times don't tell the full story of attendance, but a nearly 20% increase for Epcot from 2022 is huge though and I feel like that would've been reflected a little more in average wait times.
The drop of 9% for both USF and IOA seems to hold up relatively well judging by average wait timesIOA) (USF)
Register on WDWMAGIC. This sidebar will go away, and you'll see fewer ads.


